Chart Assignments
Charts are the core of your work. When you claim a chart, you're assigned a medical record to review and code with the appropriate diagnosis and procedure codes.
This is where you'll spend most of your time — reviewing patient documentation and translating clinical information into standardized medical codes.
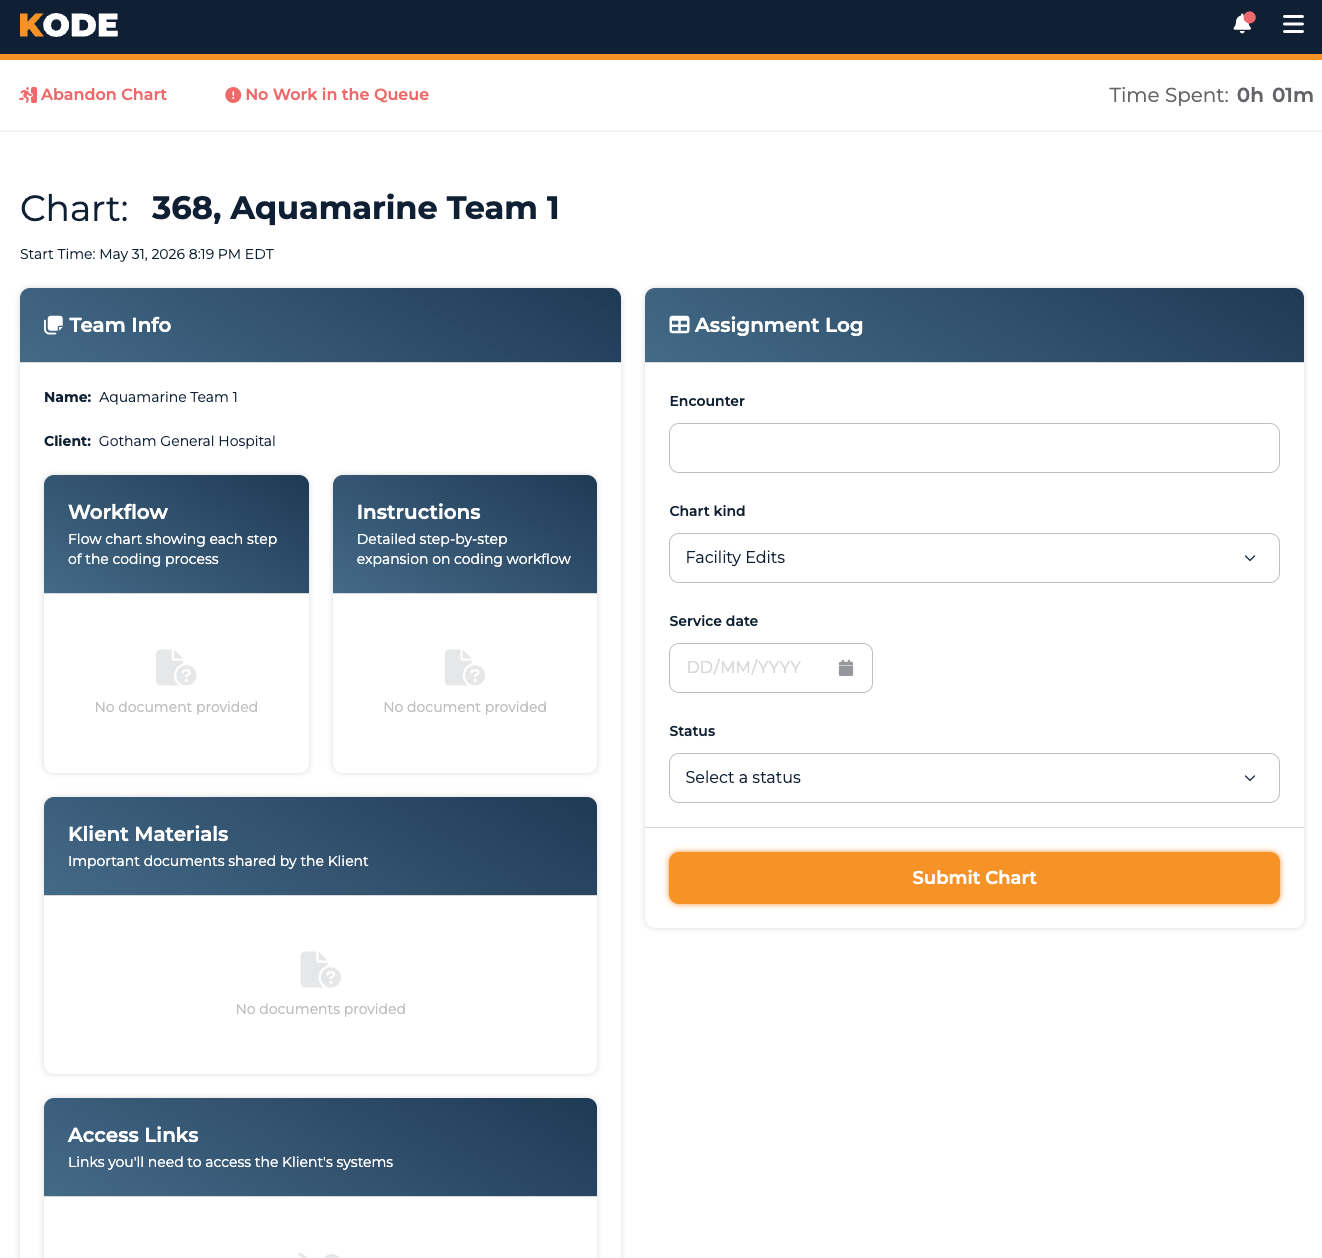
Chart interface overview
Getting Started with a Chart
Claiming Your Next Chart
To start working, go to your Dashboard, scroll to Active Teams, find a team showing Work is: Available, and click Start Work on that team's card. You'll be taken directly to the chart interface for the next chart in that team's queue.
Important: You can only have one chart in progress at a time. If you already have a chart open, the dashboard shows a warning banner with Resume Chart / Abandon Chart links at the very top — resolve that chart before claiming another.
Understanding the Chart Interface
The page is split into a few areas:
Top Action Bar — A white bar across the top with the Abandon Chart button on the left and the Time Spent counter on the right.

Top action bar with Abandon Chart button and the Time Spent counter
Chart Details — Just below the action bar, showing:
- Chart: id, team name (or id, pricing scheme name for external charts)
- Start Time — when you claimed the chart
- Time Due — only shown for some teams; the deadline by which the chart should be completed
Chart Documents — The main content area lists the documents and notes attached to the chart. Click any attachment to open it in a separate viewer.
Guidelines — Team-specific instructions, chart-kind notes, and links to reference PDFs. The content here changes based on the chart kind (Facility Radiology, ED, Hospitalist, etc.).
Selected Codes — A card titled "Selected Codes" where the codes you add show up. Empty state reads "No Codes Selected. Use Quick Add to start adding codes."
Assignment Log — The form you fill out to submit the chart. Contains the Status dropdown, optional fields like chart kind / service date / notes, and the Submit Chart button at the bottom.
Time Spent
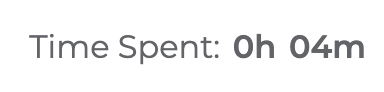
Time Spent counter that ticks upward from when you started the chart
The counter at the top of the page is a count-up timer showing how long you've had the chart open — for example, Time Spent: 0h 17m. It ticks upward from when you started; there's no deadline countdown and no color changes.
Idle timeout: If you stop interacting with the page for a while, a "Still Working?" modal appears with a Resume button. If you don't click Resume within a follow-up window, the chart automatically times out and you'll need to claim it again (or another coder will). This is an inactivity check, not a chart-completion deadline.
Adding Medical Codes
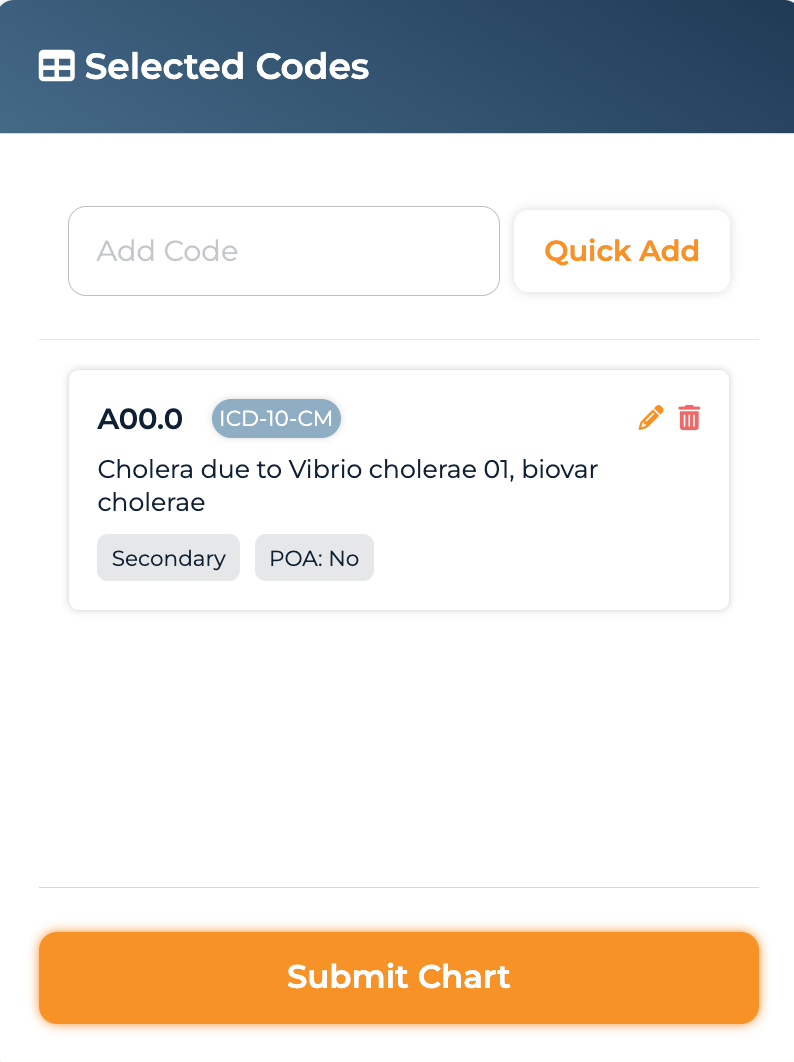
Selected Codes card showing codes added via Quick Add
Quick Add
Use Quick Add at the top of the Selected Codes card to add codes to the chart. You'll add codes from the codesets your team uses — typically:
- ICD-10 codes — diagnosis codes (e.g.,
E11.9Type 2 diabetes,I10Essential hypertension) - CPT codes — procedure/service codes (e.g.,
99213Office visit,99284ED visit)
Each code you add appears as an entry in the Selected Codes list with a pill showing its codeset kind. You can edit a code's modifiers from the inline edit modal, or remove it from the list. You can add and remove codes freely until you submit the chart.
Completing Your Work
Submitting a Chart
When you're ready to finish, fill out the Assignment Log form on the right side and click Submit Chart at the bottom. The form's key fields:
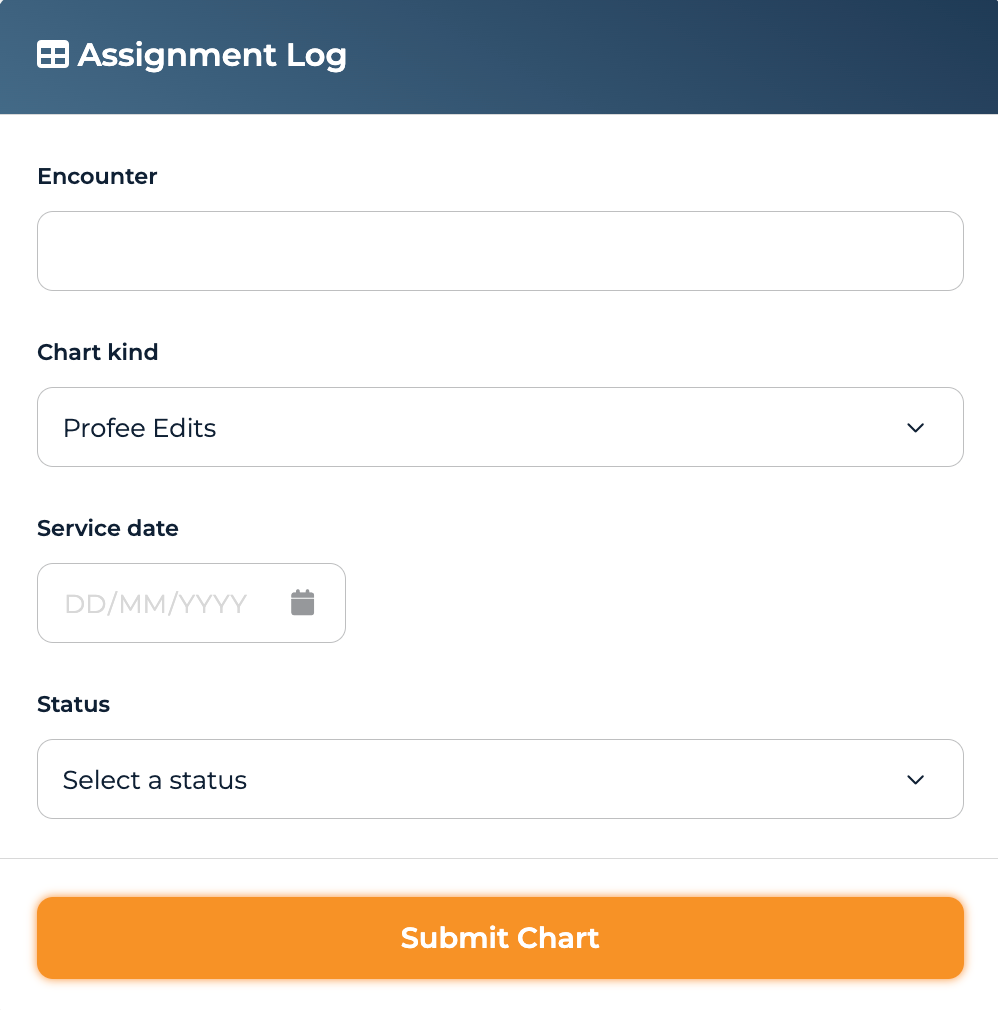
Assignment Log form with the Status dropdown, optional Notes, and the Submit Chart button
- Encounter ID — pre-filled for most charts; you only edit this on hollow-shell charts where the system doesn't know the encounter
- Chart Kind — pre-filled or selectable if the team supports multiple kinds (and Chart Kind Components if enabled)
- Service Date — the date of service for this encounter
- Status — see the table below
- Notes — only required when Status is
Unable To Complete
Status options
The Status dropdown drives what happens to the chart after submission. Pick the one that matches the situation:
| Status | When to pick it |
|---|---|
| Completed | You coded the chart fully and it's ready to move on (audit / closeout). |
| Completing Deferred Account | You're finishing a chart someone previously deferred for additional documentation or queries. |
| Deferred/Missing Documentation | Documentation is missing or incomplete — the facility needs to provide more before you can code. |
| Deferred/Query | You need provider clarification (ambiguous documentation, conflicting info, questions). |
| Unable To Complete | You can't code the chart at all. Notes are required explaining why. Not available on hollow-shell charts. |
You'll see "Mark for Query" / "Mark as Missing Information" phrasing in some teams's guidelines — those refer to picking the Deferred/Query and Deferred/Missing Documentation statuses respectively.
Abandoning a Chart
If you need to stop working on a chart for any reason, click Abandon Chart in the top action bar. The chart returns to the queue immediately and is available for you or another coder to claim again.
When to abandon:
- You need to step away unexpectedly
- The chart is outside your expertise
- Technical issues prevent completion
There's no penalty for abandoning a chart.
Viewing Completed Charts
After submitting a chart, you can view it in read-only mode:
1. Go to Work History
2. Find the chart assignment
3. Click to view the details
The read-only view shows:
- The original chart documentation
- The codes you submitted
- Submission timestamp
Released audit results are available separately from the coding view. Open Quality to review scores, encounter details, and notes.
Tips for Efficience
Before You Start
- Skim the Guidelines in the sidebar — they're chart-kind-specific and often link to a detailed PDF guide
- Check the chart kind — different specialties have different patterns
While filling out charts
- Work systematically through the chart documents
- Add codes as you find them — don't wait until the end
- Stay interactive — long pauses trigger the "Still Working?" idle prompt
- Review your Selected Codes before submitting
Common Situations
- Multiple diagnoses — Add all relevant ICD-10 codes. List the primary diagnosis first.
- Procedures with modifiers — Edit a code from the Selected Codes list to add modifiers.
- Unclear documentation — Set Status to
Deferred/Query(orDeferred/Missing Documentationif results are missing) rather than guessing.
Common Questions
Q: What does the timer mean — am I racing a deadline?
No. The counter at the top shows time elapsed since you started the chart, not time remaining. There's no per-chart deadline countdown. The only time-based interruption is the inactivity check: if you stop interacting with the page, a "Still Working?" modal asks you to confirm you're still working.
Q: What happens if I'm idle too long?
The "Still Working?" modal appears. If you don't click Resume, the chart automatically times out and you'll need to claim a new chart. Your unsaved progress on the assignment log isn't preserved.
Q: Can I save my progress and come back later?
There's no draft-save. The chart stays in progress until you either Submit it or Abandon it. If you need to stop for an extended period, abandon the chart — it goes back to the queue and you (or another coder) can claim it later.
Q: What's the difference between "Deferred/Missing Documentation" and "Deferred/Query"?
Use Deferred/Missing Documentation when the chart is incomplete — missing pages, results not attached, illegible content. Use Deferred/Query when the chart is complete but you need clinical clarification from the provider (ambiguous wording, conflicting notes).
Q: When should I use "Unable To Complete" vs the Deferred options?
Use Unable To Complete only when you can't code the chart at all — the deferred options return the chart to the workflow for follow-up, whereas Unable To Complete signals a hard stop. Notes are required so the team understands why.
Q: Why can't I claim a new chart?
You likely have a chart in progress. Check your dashboard for the warning banner about an active chart — Resume or Abandon it first.
Q: How is my pay calculated for chart assignments?
Pay is based on your team's pricing structure and the status you submitted (some statuses, like Deferred/Query, may have different payment treatment depending on the client). You can see the breakdown in Payment History after the chart is processed.